Texas Border Economy
Joshua Roberson, Weiling Yan, and Rajendra Patidar (May 11, 2022)


“This story was originally published by, Texas A&M University-Texas Real Estate Research Center.”
February 2022
Indicators along the Texas-Mexico border revealed a mixed economic response in February. Payrolls in border Metropolitan Statistical Areas (MSAs) increased on a monthly basis. Construction activity decreased while trade values improved after a decline in January. Problems like scarcity of raw material and low availability of truck drivers persisted. Housing sales increased. The combination of robust demand, depleted inventory, and elevated home prices caused affordability to remain a challenge for potential homebuyers. In addition to COVID-19-related supply-chain disruptions, the global economy is facing an unpredictable course of action in eastern Europe as Russia accelerates its aggression in Ukraine, disrupting the global economy and international trade.
Economy
The economy continued its growth, indicated by the Dallas Fed’s Business-Cycle Indexes. McAllen’s metric accelerated 1.8 percent on a seasonally adjusted annualized rate (SAAR) amid solid payroll expansions. El Paso’s index elevated 3.4 percent, while Brownsville and Laredo’s indexes increased 5.6 and 4.3 percent, respectively. Pedestrian and personal-vehicle crossings grew by 59.8 and 27.2 percent, respectively, above year-ago levels (Figures 1 and 2) as the Department of Homeland Security revised its policy to allow non-citizens who are fully vaccinated and have appropriate documents to travel through borders in early November 2021.


Overall, border nonfarm employment added 2,200 jobs, resulting in SAAR growth of 2.4 percent. Laredo added 500 positions, led by gains in government and transportation. El Paso added 200 jobs, many of which were created in the goods-producing and manufacturing sectors. Meanwhile in the Rio Grande Valley, Brownsville and McAllen added 500 and 1,000 jobs, respectively.
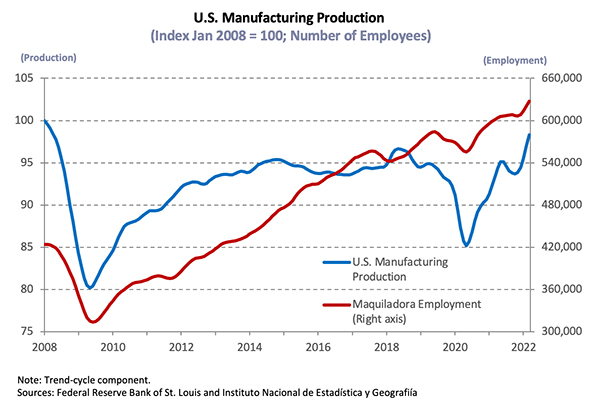
On the southern side of the border, Mexican manufacturing and maquiladora employment1 contracted by 3,276 jobs in January. Reynosa’s employment decreased by 0.1 percent and Juarez’s increased by 0.6 percent month over month (MOM) after 161 workers were laid off in the former and 1,697 were added in the latter. Maquiladora employment in Matamoros and Nuevo Laredo accelerated 0.1 percent and decreased by 4 percent, respectively, on MOM basis after adding 61 workers in the former and laying off 1,234 in the latter. On the U.S. side of the border, motor vehicle manufacturing continued declining due to supply chain issues in procuring semiconductor chips. The IHS Markit Mexico Manufacturing PMI for February indicated reported further deterioration in the health of Mexico’s manufacturing sector, albeit one that was softer than in January. Output contracted, owing to raw material scarcity and poor sales, but the downturn was the mildest in the current two-year period of monthly reductions.
Unemployment rates ticked down by 10 basis points along the border metros. Joblessness fell to 5.1 percent in El Paso and 5.3 percent in Laredo, while the Rio Grande Valley’s metrics fell to 8 percent in McAllen and 7.2 percent in Brownsville. Additionally, the labor force participation rate ticked up, while the number of weekly initial unemployment claims didn’t change for across the border in February (Figure 3).
Fluctuations in the average private hourly earnings revealed negative real wage growth along the border except in McAllen. Some of the downward pressure may be due to the recovery of lower-paying jobs that bore the brunt of the COVID-19-related layoffs, pulling the average wage down. Moreover, inflationary pressures prevented meaningful gains in purchasing power. Earnings in McAllen fell 6.2 percent year over year (YOY) in real terms to a nominal wage of $19.38 in February. Hourly wages in Laredo ($18.97) and Brownsville ($17.56) also trended downward, decreasing 1.7 and 4.74 percent, respectively. El Paso reported a 2.0 percent increase on a YOY basis. While baseline effects mechanically weighed on YOY numbers, nominal wages are approaching pre-pandemic levels along the border.
Total construction values decelerated during February, decreasing 37 percent. Both residential and non-residential values for McAllen decreased drastically and experienced monthly contractions after rebounding the previous month. Similar trends continued in Brownsville and El Paso. Meanwhile, residential and nonresidential values increased substantially in Laredo.
In the currency market, the peso-per-dollar exchange rate dropped to $20.45, but the inflation-adjusted rate2 decreased 3.6 percent YOY and 0.1 percent MOM, revealing gains for Mexican importers. Despite ongoing hostility in eastern Europe and continued supply-chain bottlenecks, total trade values increased by 3.1 percent along the border after a decrease in values during January. At the metropolitan level, imports grew by 4.4 percent across the border due to expanding trade activities in Brownsville and McAllen, which rose by 5.4 and 4.8 percent, respectively. Similarly, the metric rose by 1.2 and 3.2 percent in El Paso and Laredo. Exports increased 1.6 percent along the border with Laredo and El Paso increasing by 11 and 2.3 percent, respectively. Export values decelerated 9.6 percent in Brownsville and increased by 5.6 percent in McAllen while the metric rebounded in other border areas. Brownsville’s exports have decreased continuously since third quarter 2021. The border’s trade sector remains an integral component of the local economies. Ongoing supply-chain disruptions uniquely affected El Paso as its international commerce is largely dependent on products that contain semiconductors.
Housing
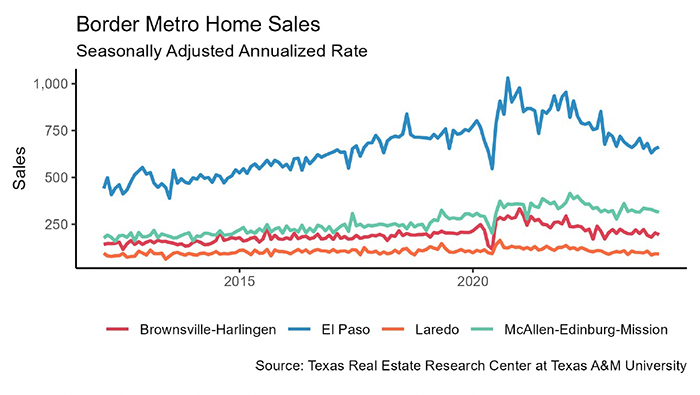
Border housing sales rebounded in February, increasing 5.2 percent after declining in January, while inventory constraints and reduced housing affordability persisted. The Rio Grande Valley was a mixed bag as sales increased 6.3 percent in Brownsville and decreased 3.9 percent in McAllen. Sales activity rebounded in Laredo and El Paso as the metrics increased by 4.8 and 5.8 percent, respectively.
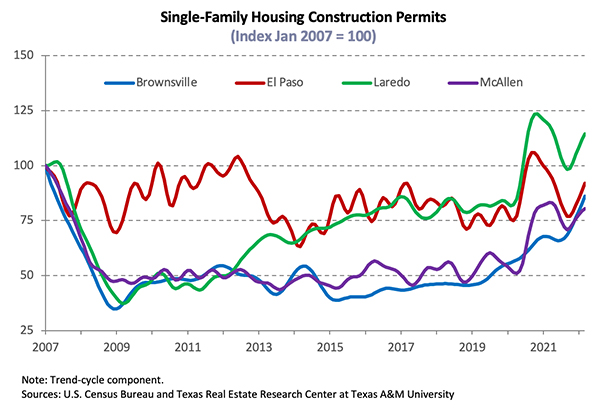
The border metros issued 846 single-family housing construction permits, decreasing 12.2 percent MOM due to a decrease in new permits issued in the Rio Grande Valley. The downward trend persisted in McAllen and Brownsville, which reported 12.2 and 48.5 percent declines, respectively. Meanwhile, both El Paso and Laredo reported a slight increase of 1.4 percent. On the other hand, private single-family construction values posted positive YTD growth but saw a decline in MOM values. While construction values corroborated positive levels of the current supply-side activity, the dearth of permits suggests long-term supply challenges.
While a balanced housing market typically has a months of inventory closer to six months, the months of inventory (MOI) along the border remained much lower than this benchmark. Laredo’s growing sales activity and a downtick in new listings pushed the MOI down to 1.74 months. El Paso’s metric decreased to less than a month. McAllen’s metric fell continuously to 1.98 months, while Brownsville’s inventory remained at 1.50 months in February. This indicated inventory levels are declining and ongoing construction needs to be completed at a rapid pace.
The average number of days on market (DOM) along the border varied on a monthly basis; however, compared with year-ago levels, the metric remained exceptionally low. El Paso’s DOM rose to 43 days, while McAllen’s metric rose to 52 days. Laredo’s DOM decreased to 38 days, while Brownsville listings averaged nearly two months on the market.
Compositional changes contributed to growth in the median home price along the border metros as tight inventories at the lower-end of the market pushed activity into higher price cohorts. El Paso’s and Brownsville’s metrics were at all-time highs of $228,547 and $261,949, respectively. Median home prices for McAllen remained at $209,315 after hitting a record-high in December 2021, while Laredo’s metric increased from $219,662 to $233,911.
____________________
1 Mexican manufacturing and maquiladora employment data are generated by the Instituto Nacional de Estadística y Geografía. Its release typically lags the Texas Border Economy by one month.
2 The real peso per dollar exchange rate is inflation adjusted using the Texas Trade-Weighted Value of the Dollar. Its release typically lags the Texas Border Economy by one month.

To view the entire report, Click to access 2165.pdf.
To see the previous month’s report, click here. For the report from a year ago, click here.
Previous reports available:
2022: January, February, March, April
2021: January, February, March, April, May, June, July, August, September, October, November
2020: January, February, March, April, May, June, July, August, September, October, November, December