May 2022 Texas Border Economy Report
Texas Border Economy
Joshua Roberson and Rajendra Patidar (Jul 21, 2022)


May 2022
Texas’ border economy has begun rebounding from the COVID-19 pandemic as the virus and global conditions have started to normalize. However, economic indicators for May showed mixed responses. The border economy depends heavily on international trade and labor supply with Mexico, which can be valued at about $350 billion per year.
Payrolls in border Metropolitan Statistical Areas (MSAs) showed little or no growth. Construction activity increased and trade improved as imports increased across the border areas, but growing inflation, scarcity of raw materials, and supply chain issues persisted. Home sales decreased for the second time this year, primarily due to rising home prices and higher mortgage rates. Mortgage rates recently jumped to a 14-year high, and homebuilders and real estate agents are reporting a significant pullback in sales. Rising median home prices and depleting inventory remained challenges for housing markets. In addition to COVID-19-related supply chain disruptions, conflict in eastern Europe and Russia’s aggression in Ukraine disrupted the global economy and international trade. Rising inflation and interest rates will likely hamper demand and the overall border economy in the future.
Economy
The Dallas Fed’s Business-Cycle Indexes indicated a rise in economic growth. McAllen’s metric accelerated 7.9 percent on a seasonally adjusted annualized rate (SAAR) amid the largest payroll expansion among all border metros. El Paso’s index was up 0.5 percent, while Brownsville and Laredo’s indexes increased by 3 and 5.7 percent, respectively. Pedestrian and personal vehicle crossing have continuously increased since the government lifted the restrictions. There was a surge in immigrants trying to enter through the Texas-Mexico border and seek asylum in the United States.
Overall, border nonfarm employment didn’t grow in May. McAllen added 900 jobs while El Paso lost 900. Laredo and Brownsville reported insignificant job growth. Trade and transportation reported major job losses. On the southern side of the border, Mexican manufacturing and maquiladora employment1increased by 6,475 jobs in May. Reynosa’s employment increased by 1.1 percent and Juarez’s by 0.9 percent month over month MOM) after adding 1,602 and 2,763 workers, respectively. Meanwhile, maquiladora employment in Matamoros and Nuevo Laredo accelerated by 0.6 percent and 2.7 percent MOM, respectively, after adding 426 workers in the former and 817 in the latter. Global supply chain pressures declined in May after a sudden increase earlier in the year. Global Supply Chain Pressure Index (GSCPI) indicated that, although global supply chain pressures have been decreasing, they remain at historically high levels.
The S&P Global Mexico Manufacturing PMI for May indicated further deterioration in the overall confidence of Mexican manufacturing primarily due to outstanding business and the second sharpest rise in input cost in a decade. Demand sank, causing a decline in factory orders and production output.
The average unemployment rate among the border metros fell to 6 percent in May. Joblessness fell to 4.7 percent in both El Paso and Laredo, while metrics for the Rio Grande Valley fell to 7.6 percent and 6.6 percent in McAllen and Brownsville, respectively. Additionally, the labor force participation rate ticked up across the state, and there was no change in weekly initial unemployment claims across border areas during May (Figure 3).
Fluctuations in the average private hourly earnings revealed mixed growth along the border as wages fell in McAllen and Laredo. Moreover, inflationary pressures prevented meaningful gains in purchasing power. Earnings in McAllen fell in real terms to an average nominal wage of $19.35. Hourly wages in Brownsville ($17.89) trended upward, increasing by 0.62 percent, while Laredo ($19.37) reported a decrease of 0.31 percent MOM. El Paso’s average private hourly earnings were at an all-time high of $21.96, increasing 2 percent over the previous month. While baseline effects are mechanically weighed on year-over-year (YOY) numbers, nominal wages are approaching pre-pandemic levels along the border.
Total construction values accelerated during May due to improvement in overall residential construction values. Changes in residential and nonresidential values varied across border areas. El Paso reported notable progress in nonresidential values due to continuous growth in the construction of stores, offices, and hotels. Construction of stores and restaurants increased in McAllen, but overall values are due to a decline in other sectors. On the other side, both residential and nonresidential values decreased in Laredo and Brownsville.
In the currency market, the peso per dollar exchange rate dropped to $20.05, but the inflation-adjusted rate2 decreased 5.8 percent YOY and 2.5 percent MOM, revealing gains for Mexican importers. Total trade values increased by 6.3 percent along the border areas in May. At the metropolitan level, total imports grew by 4.2 percent due to expanding trade activities in McAllen and Brownsville, rising 16 and 7.5 percent, respectively. Exports increased 9.2 percent along the border with Laredo and McAllen increasing by 8.1 and 6.4 percent, respectively. Export values accelerated in El Paso exponentially, while the metric is rebounding after declining in the initial months of the year. The border’s trade sector remains an integral component of the local economies. El Paso’s trade performance was phenomenal due to impressive growth in exports and reduction in imports, which made it the only trade surplus county in the Texas border area.
Housing
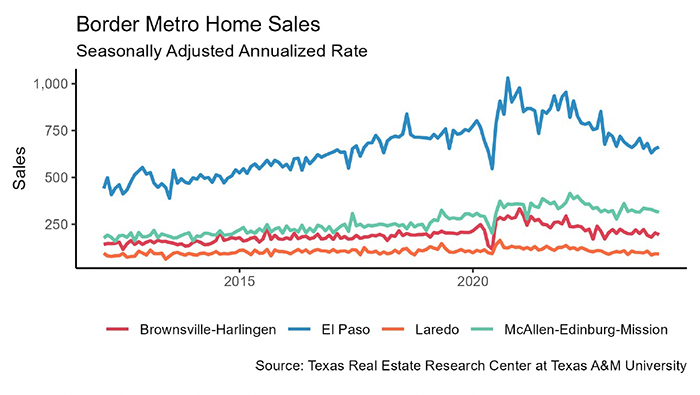
Border housing sales were mostly unchanged in May after rising earlier in the year. In the Rio Grande Valley, McAllen posted a 4 percent decrease in housing sales, and Brownsville had a 9 percent decline. Sales activity in Laredo increased slightly, while El Paso’s metric rose by 3.2 percent after consecutive declines in the last two months. The sharp increase in mortgage rates is the primary reason for dwindling housing demand. The Federal Home Loan Mortgage Corporation’s 30-year fixed rate was 5.23 percent in May, rising exponentially during the second quarter of this year from a record low of 2.7 percent in January 2021.
The border metros issued 990 single-family housing construction permits, decreasing 2.6 percent from the prior month due to a 17.6 percent drop in El Paso. A similar trend continued in Brownsville and Laredo as metrics fell by 5.5 percent in the former and 6.2 percent in the latter. McAllen continued issuing new permits for the last three months. On the other hand, private single-family construction values trended downward as the metric declined by 10.5 percent in the border area. Values decreased 22.5 percent in El Paso and 17.3 percent in Laredo. Construction activity in the Rio Grande Valley declined as the metric fell by 15.9 percent in McAllen and 4.2 percent in Brownsville.
While construction values corroborated positive levels on the current supply-side activity, the dearth of permits suggests long-term supply challenges. Supply chain and labor issues have slowed developers’ ability to respond by ramping up construction as reported by Camden Property Trust, a Houston-based real estate investment company.
While a balanced housing market typically has a months of inventory (MOI) closer to six months, the MOI along the border remained much lower than this benchmark. Laredo’s declining sales activity and a downtick in new listings pushed the average MOI for May to two months. El Paso’s metric remained at one month. McAllen’s metric increased continuously to 2.4 months, while Brownsville’s inventory increased to two months. The increase in MOI during May indicates housing inventory is increasing primarily due to a decrease in home sales.
Plunging home sales increased the average number of days on market (DOM) along the border. El Paso’s DOM increased to 45 days while it was nearly two months in McAllen. Laredo’s DOM decreased to 37 days while listings in Brownsville averaged less than two months on the market.
Rising inflation contributed to growth in the median home price. Tight inventories at the lower end of the market pushed activity into higher price cohorts. El Paso’s metric hit an all-time high of $238,528. Brownsville’s was $268,538. McAllen remained at $223,898 after a fall during the initial months of the year, while Laredo’s metric increased from $214,308 to $219,741. The border area’s housing market is known for its affordability, a factor that has attracted many homebuyers.
____________________
1 Mexican manufacturing and maquiladora employment data are generated by the Instituto Nacional de Estadística y Geografía. Its release typically lags the Texas Border Economy by one month.
2 The real peso per dollar exchange rate is inflation adjusted using the Texas Trade-Weighted Value of the Dollar. Its release typically lags the Texas Border Economy by one month.