Texas Border Economy
Joshua Roberson and Rajendra Patidar (May 2, 2023)


Economic indicators along the border showed mixed responses in February. Payroll contracted in all border Metropolitan Statistical Areas (MSAs), corroborated by increases in unemployment rates and unemployment claims. Commercial real estate activity has not expanded, but residential construction activity has improved. Net trade values were up, and the gap between imports and exports leading to the trade deficit reduced.
Demand for homes was strong, which had a stabilizing effect on days on market, inventory, and median home prices. Inflation rose in February but was in line with expectations as energy prices dropped.
Economy
Overall economic conditions along the border stalled in February according to the Dallas Fed’s Business-Cycle Indexes. While the metrics have reflected robust economic growth in past quarters, each of the border metros declined in February. El Paso and Brownsville-Harlingen reported declines of 3.6 and 4.4 percent, respectively, at a seasonally adjusted annualized rate. Meanwhile, the metric shrank by 2.7 percent in McAllen and 5.4 percent in Laredo.
Overall, border nonfarm employment lost 1,100 positions as El Paso lost 1,400 jobs (Table 1). Sectors like trade, transportation, and professional and business services were major contributors to employment growth in the border region. Additionally, pedestrian and personal vehicle crossings at the border were down by 7.6 percent and 11.4 percent, respectively. Although there’s been a reduction in border crossings in the past couple of months, they are up significantly from a year ago.

Overall job loss impacted the unemployment rates in border metros. The border region’soverall unemployment rate rose to 5.5 percent in February. Joblessness in both Laredo and El Paso increased by 2 percentage points, while Brownsville’s unemployment rate remained unchanged at 5.9 percent. Meanwhile, McAllen’s metric fell to 6.6 percent. The labor force participation rate ticked down statewide, while weekly unemployment claims declined across border areas.
Average hourly earnings fluctuate monthly, but the overall trend shows earnings have increased substantially post pandemic. Much of the gain has been eroded by inflation. Nominal wages across the border averaged $20.73, while they stabilized at $22.69 in El Paso. Hourly wages in McAllen rose to $22.09, while the metric fell in Brownsville to $18.57.
On the southern side of the border, Mexican manufacturing and maquiladora employment1 showed signs of improvement with an addition of more than 5,500 jobs in January (Table 2). There was a contraction in jobs in the last quarter, but overall employment has expanded post pandemic.

Global supply chain pressures decreased considerably in February and are now below the historical average as indicated by the Global Supply Chain Pressure Index (GSCPI). The GSCPI’s recent movements suggest global supply chain conditions have returned to normal after experiencing temporary setbacks around the turn of the year.
The S&P Global Mexico Manufacturing PMI for February improved with renewed growth of new orders, employment, and sales. Business sentiment remained positive amid inflation concerns.
In the currency market, the peso per dollar exchange rate averaged $18.642. After adjusting for inflation, the metric decreased over the month, revealing gains for Mexican importers. In a broader context, the decline in real effective exchange rate (REER) for the second consecutive month reveals the softening of the U.S. dollar relative to its 2022 peaks.
The Texas-Mexico border processes more than $500 billion in trade annually. The net border trade value increased by 1.3 percent in February, resulting in a reduction in the trade deficit and higher exports from Texas. Brownsville and Eagle Pass ports saw a rise in exports at the metropolitan level, resulting in positive net trade. Meanwhile, El Paso’s and McAllen’s trade values declined.
Real Estate
Border metros offer a variety of business and investment opportunities in different sectors such as trade, transportation, and logistics. Some segments of construction activity have risen due to investments in retail space, healthcare, and warehouses, and because of recovering housing demand in recent months. Changes in residential and nonresidential construction values varied across border areas. Commercial construction values were lower in February than a year ago, except for McAllen-Edinburg-Mission, which added 106 percent (YOY) higher dollar values. Residential construction reported steady growth in El Paso and Laredo, while the values plummeted in Brownsville-Harlingen and McAllen.
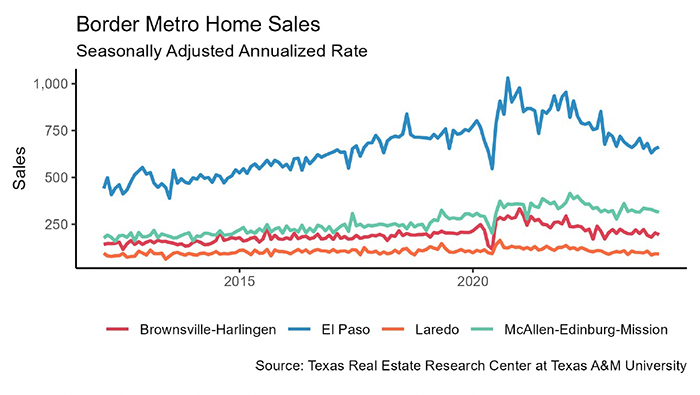
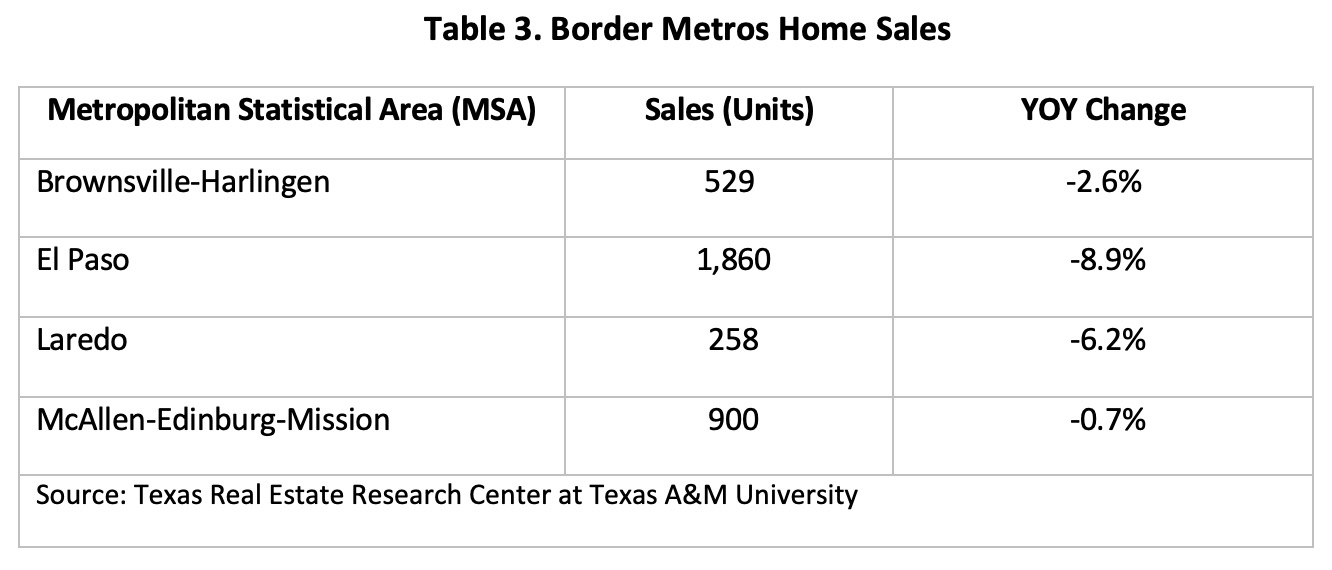
February’s overall housing sales surged by 11.8 percent MOM after seasonal adjustments (Table 3). The metric went up across all major metros except Laredo, which reported a slight decline. These closed deals mostly consist of single-family homes and condominiums, especially in Brownsville.
Housing sales have been volatile in recent months primarily due to the market’s dependency on mortgage rates. Freddie Mac’s 30-year fixed rate was 6.8 percent in February. Consumer buying behavior has changed in the last few months with concerns about rising mortgage rates and high inflation.
Border metros reported no change in single-family housing construction permits in February. A total of 626 permits were issued in all border metros, with the highest in the El Paso area. New permits were down in the last two quarters of 2022, but recent growth indicates a possible recovery in housing markets.
Volatility in housing markets led to a rise in months of inventory (MOI) along the border, though the metric remained much lower than the six-month historical norm. Rising demand for houses in the Rio Grande Valley reduced the available inventory to 4.1 months in both McAllen and Brownsville. Laredo’s declining sales activity and an uptick in new listings pushed February’s average MOI to 3.4 months. El Paso’s metric was more than two months, while Brownsville’s metric averaged around four months. These increases indicate inventory is growing primarily due to a decrease in home sales and an increase in listings.
Average days on market (DOM) in February varied across the border. The marketing window in Brownsville and McAllen took a little over two months to complete a sale. Meanwhile, the metric for El Paso’s DOM rose to 55 days (about two months), and Laredo’s DOM moved up to 45 days (about one-and-a-half months).
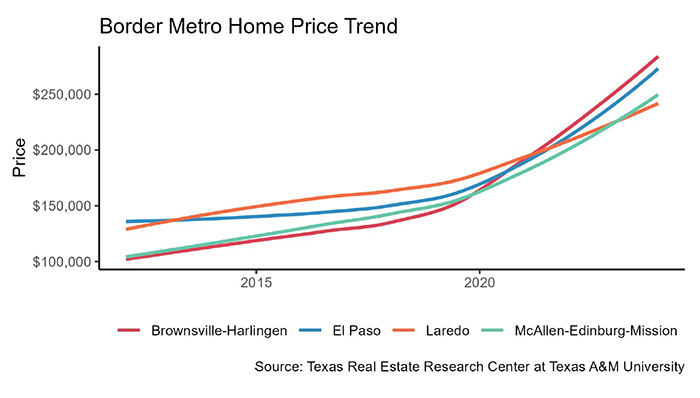
Price changes varied, even with strong demand in all markets. Seasonally adjusted median home prices grew across border regions in February (Table 4). The border region’s housing market is known for its affordability, a factor that has attracted many buyers from other areas.

1 Mexican manufacturing and maquiladora employment are generated by the Instituto Nacional de Estadística y Geografía. Its release typically lags the Texas Border Economy by one month.
2 The real peso per dollar exchange rate is inflation adjusted using the Texas Trade-Weighted Value of the Dollar.